Poverty in India has evolved from a narrow income-based concept to a multidimensional understanding that includes deprivations in health, education, and living standards. While recent data indicate a sharp decline in extreme poverty due to economic growth and welfare interventions, structural inequalities and vulnerability continue to sustain pockets of deprivation. A combination of inclusive growth, human capital development, and effective governance remains essential for sustainable poverty reduction.
Copyright infringement not intended
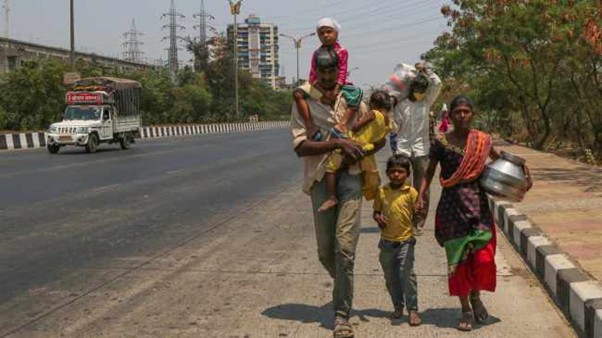
Picture Courtesy: Indian Express
Context:
India has “virtually eliminated” extreme poverty between 2011-12 according to a new paper authored by Columbia University professor and Sixteenth Finance Commission Chairman Arvind Panagariya and Vishal More, founder of the New Delhi-based research and consulting firm Intelink Advisors
|
Must Read: POVERTY IN INDIA | TRUTH ABOUT POVERTY IN INDIA | New Poverty Line | EXTREME POVERTY IN INDIA | MULTIDIMENSIONAL POVERTY IN INDIA | |
Key highlights of the Panagariya–More Study on Poverty in India:
What is Poverty?
Poverty is a condition in which people lack the resources to meet basic human needs such as adequate food, clothing, shelter, education, and healthcare. – World Bank
The World Bank commonly measures extreme poverty as living on less than $3 per person per day (PPP).
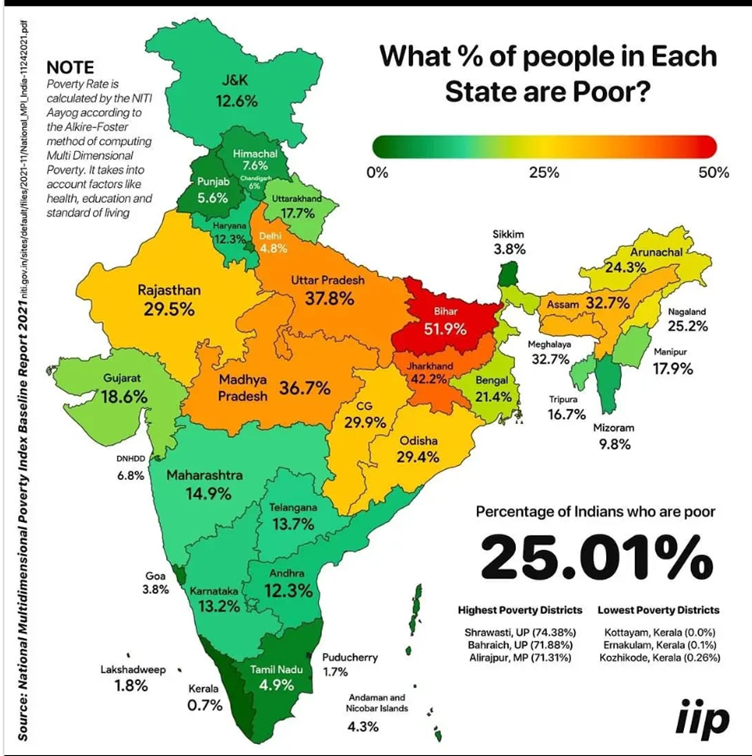
According to NITI Aayog, Poverty is multidimensional deprivation across health, education, and living standards rather than only low income.
It uses MPI indicators such as nutrition, schooling, sanitation, housing, and access to basic services.
How poverty is estimated in India?
Poverty estimation in India is primarily based on the idea that a person is poor if their consumption expenditure falls below a minimum level required to meet basic needs, though in recent years the approach has expanded to include multidimensional deprivations beyond income.
Calorie-Based Approach
In the initial decades after Independence, poverty was estimated using a calorie intake norm, where poverty lines were linked to minimum daily calorie requirements—2,400 calories in rural areas and 2,100 calories in urban areas—with corresponding consumption expenditure used as a proxy.
Role of the Planning Commission
The Planning Commission was historically responsible for poverty estimation and used data from the National Sample Survey (NSS) on household consumption expenditure to estimate poverty at national, state, rural, and urban levels.
Lakdawala Committee Method (1993)
The Lakdawala Committee retained the calorie norm approach but allowed state-specific poverty lines by adjusting for price differences, though it was criticised for underestimating non-food essentials like health and education.
Tendulkar Committee Method (2009)
The Tendulkar Committee (2009) conceptualised poverty as the inability to afford minimum consumption for food, health, education, clothing, housing, fuel, and transport, using actual consumption behaviour rather than fixed calorie norms.
Poverty line (per person per month):
Rangarajan Committee Method (2014)
he Rangarajan Committee redefined poverty as inability to afford a normative level of consumption necessary for a dignified life, moving beyond mere calorie sufficiency.
The poverty line was constructed using explicit norms for:
Poverty Line Levels (2011–12)
These were significantly higher than Tendulkar poverty lines, resulting in higher poverty estimates.
Poverty Ratio under Rangarajan Method
Using this method, poverty in 2011–12 was estimated at 29.5% of the population, compared to 21.9% under the Tendulkar method, highlighting methodological sensitivity.
Data Source and Survey Methodology
Poverty estimation is based on Household Consumption Expenditure Surveys (HCES) conducted by MoSPI, which use a Modified Mixed Reference Period (MMRP)—
NITI Aayog and MPI
After the dissolution of the Planning Commission, NITI Aayog moved away from a single income-based poverty line and adopted the Multidimensional Poverty Index (MPI), which measures poverty across health, education, and living standards.
Multidimensional Poverty Index (MPI) Approach
The Multidimensional Poverty Index (MPI) is based on Amartya Sen’s capability approach, which views poverty as deprivation of basic capabilities and opportunities, rather than merely low income or consumption.
MPI recognises that households may be non-poor by income standards yet remain poor due to lack of access to health, education, or basic living conditions, making poverty a multifaceted phenomenon.
In India, MPI is measured by NITI Aayog in collaboration with UNDP and OPHI (Oxford Poverty and Human Development Initiative), using data from NFHS and other national surveys.
Dimensions of MPI
MPI captures poverty across three core dimensions:
Each dimension is equally weighted, reflecting balanced importance in human development.
Indicators and Deprivations
India’s MPI uses 12 indicators:
What are the different types of Poverty?
Absolute Poverty: Absolute poverty refers to a condition where individuals lack the minimum resources necessary for physical survival, such as food, clothing, and shelter, and is measured against a fixed poverty line based on basic needs.
Relative Poverty: Relative poverty exists when individuals are economically disadvantaged compared to the average living standards of society, highlighting inequality and social exclusion rather than mere survival.
Extreme Poverty: Extreme poverty is the most severe form of deprivation, where people are unable to meet basic caloric and consumption needs, often measured internationally as living below the World Bank’s extreme poverty threshold.
Multidimensional Poverty: Multidimensional poverty captures simultaneous deprivations in health, education, and living standards, recognising that poverty is not only about income but also about capabilities and access to services.
Chronic Poverty: Chronic poverty refers to long-term or intergenerational poverty, where individuals or households remain poor over extended periods due to structural factors like poor education, social exclusion, or geographic isolation.
Urban Poverty: Urban poverty is characterised by informal employment, insecure housing, high living costs, and limited access to social protection, particularly among slum populations.
Working Poverty: Working poverty occurs when individuals are employed yet remain poor, due to low wages, informal jobs, and lack of social security, highlighting issues of job quality rather than job availability.
What are the factors leading to poverty in India?
Rapid population growth: Rapid population growth continues to strain land, employment, housing, and public services, reducing per capita availability of resources. States with higher fertility rates such as Bihar and Uttar Pradesh have historically recorded higher poverty ratios, reflecting how population pressure dilutes income gains despite economic growth.
Unemployment and underemployment: A large share of India’s workforce remains trapped in low-productivity and informal employment, leading to working poverty. According to Periodic Labour Force Survey (PLFS) data, nearly 90% of workers are informal, with many engaged in casual or self-employment that yields irregular and low incomes, particularly in construction and agriculture.
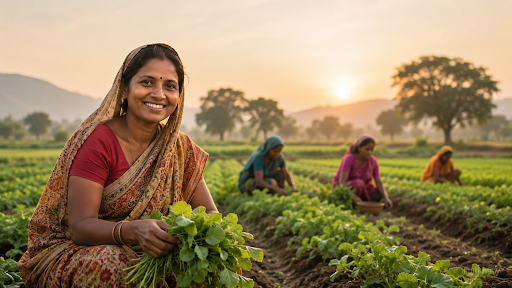
Low agricultural productivity: Agriculture employs about 45% of India’s workforce but contributes only around 15% to GDP, indicating low productivity. Small and fragmented landholdings—over 86% of farmers are marginal or small—combined with dependence on monsoons keep rural incomes low, as seen in recurrent agrarian distress in rain-fed regions of Vidarbha and Bundelkhand.
Unequal distribution of income and assets: Economic growth in India has been uneven, with wealth concentrated among the top income groups. Data from World Inequality Database show that the top 10% own over 65% of national wealth, while landlessness remains widespread among rural households, perpetuating poverty among agricultural labourers.
Illiteracy and skill deficit: Poor access to quality education and skills restricts employability and income mobility. ASER reports consistently show learning deficits among children from poor households, limiting their future earnings and reinforcing intergenerational poverty, particularly in rural and tribal regions.
Poor health and high out-of-pocket expenditure: Health shocks are a major driver of poverty in India. According to NSS health expenditure data, nearly 55–60% of health spending is out-of-pocket, often pushing households into poverty. For example, treatment costs for chronic illnesses such as cancer frequently force poor families to sell assets or incur high debt.
What are the measures to reduce poverty in India?
Employment generation and livelihood security: Government programmes focusing on employment creation directly address income poverty. MGNREGA, by guaranteeing 100 days of wage employment, has acted as a safety net during agricultural off-seasons.
Agricultural reforms and rural development: Since rural poverty is closely linked to low farm incomes, measures such as PM-KISAN income support, expansion of irrigation under PM Krishi Sinchayee Yojana, crop insurance through PMFBY, and promotion of allied activities like dairy and fisheries help stabilise rural livelihoods and reduce agrarian distress.
Food security and nutritional support: Ensuring access to affordable food is central to poverty reduction. The National Food Security Act (NFSA), along with schemes like PM Garib Kalyan Anna Yojana, has reduced hunger and consumption poverty by providing free or subsidised food grains to vulnerable households.
Human capital development through education: Investment in education breaks intergenerational poverty. Schemes such as Samagra Shiksha, mid-day meals, and scholarships for SC/ST/OBC and minority students improve school retention and learning outcomes, enhancing long-term earning capacity of the poor.
Health protection and financial risk coverage: Health shocks are a major cause of impoverishment. Ayushman Bharat – PM Jan Arogya Yojana provides health insurance cover to poor households, reducing catastrophic out-of-pocket expenditure that often pushes families into poverty.
Skill development and employability: Skill enhancement improves access to better-paying jobs. Programmes like Skill India Mission, PM Kaushal Vikas Yojana, and apprenticeship reforms help align workforce skills with market demand, especially for youth and informal workers.
Financial inclusion and access to credit: Access to banking and credit enables savings, investment, and entrepreneurship. Initiatives such as Jan Dhan Yojana, Mudra loans, and SHG–Bank linkage have helped poor households and micro-entrepreneurs reduce dependence on moneylenders and increase income opportunities.
Housing, sanitation and basic services: Provision of basic amenities improves living standards and productivity. Schemes like PM Awas Yojana, Swachh Bharat Mission, Jal Jeevan Mission, and rural electrification have addressed multidimensional poverty by improving health, dignity, and time use, especially for women.
Direct benefit transfers: Use of Aadhaar-based Direct Benefit Transfer (DBT) has reduced leakages and improved targeting of welfare schemes. Efficient delivery ensures that public spending reaches the intended beneficiaries, maximising poverty-reducing impact.
Targeted support for vulnerable groups: Focused interventions for SCs, STs, minorities, women, elderly, and persons with disabilities help address structural poverty. Hostels, pensions, livelihood missions, and nutrition programmes reduce social exclusion and vulnerability.
Conclusion:
Poverty is a multidimensional challenge that goes beyond low income to include deprivations in health, education, living standards, and opportunities. While India has made significant progress in reducing extreme poverty through economic growth and welfare interventions, structural inequalities, vulnerability to shocks, and intergenerational disadvantages continue to sustain pockets of deprivation. Sustainable poverty reduction therefore requires not only income support but also human capital development, inclusive growth, and effective governance to ensure dignity and opportunity for all.
Source: Indian Express
|
Practice Question “Poverty in India is no longer merely an income deficit but a multidimensional deprivation.” Discuss this statement in the context of evolving poverty estimation methods and government interventions aimed at poverty reduction in India. (250 words) |
Poverty is a condition in which individuals lack adequate income and resources to meet basic needs such as food, shelter, education, healthcare, and a dignified standard of living.
India traditionally measures poverty using consumption expenditure-based poverty lines (Tendulkar method) and increasingly uses the Multidimensional Poverty Index (MPI) to capture non-income deprivations.
Consumption is considered more stable and reliable than income, especially in an economy dominated by informal and seasonal employment.


© 2026 iasgyan. All right reserved