Description
Disclaimer: Copyright infringement not intended.
Context
- Extreme poverty in India has declined according to a paper of the World Bank titled as: ‘Poverty has declined over the last decade But Not As Much As Previously Thought.
Extreme Poverty
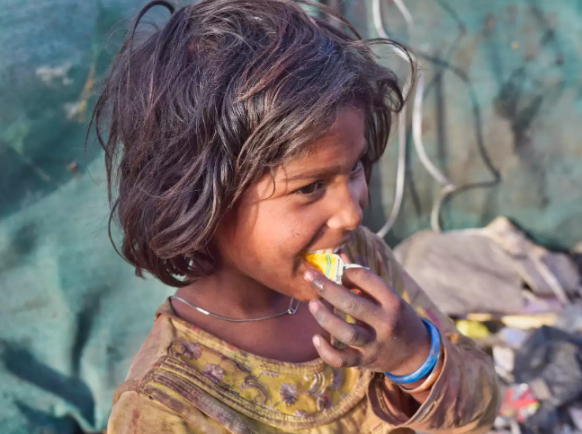
- Extreme poverty, deep poverty, abject poverty, absolute poverty, destitution, or penury, is the most severe type of poverty.
- World Bank defines ‘living in extreme poverty’ in India as living on $1.9 or less in purchasing power parity (PPP) terms.
Key Findings of the recent report by World Bank
Extreme Poverty levels
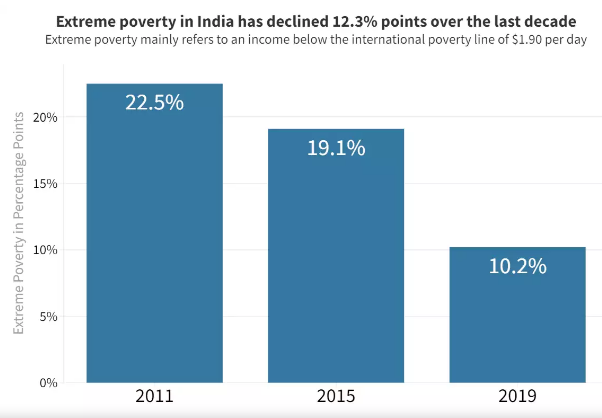
- Extreme poverty in India has declined by 12.3 percentage points from 2011 to 2019.
- It has declined to 10.2 per cent in 2019, from a 22.5 per cent in 2011.
Rural vs Urban Poverty
- Reduction in abject poverty in rural areas is more pronounced than in urban areas.
- Rural extreme poverty dropped by 14.7 percentage points during this period, while urban deep poverty fell by 7.9 percentage points.
More Poverty reduction in later years
- In the first half of the decade, extreme poverty declined to 19.1%. The remaining 9.1% drop was achieved in the later years, between 2015 and 2019.
- Extreme poverty dropped by 3.2% points between 2017 and 2018 alone, which was the fastest rate in over two decades.
Consumption inequality
- Consumption inequality in India has moderated after 2011, with almost no change between 2015 and 2019.
Real Income of Farmers
- Farmers with small landholding sizes have experienced higher income growth. Real incomes for farmers with the smallest landholdings have grown by 10 per cent in annualized terms between 2013 and 2019.
Marginal increase in Poverty during Demonetization
- Poverty marginally increased for a brief period at least twice in the last decade. This was around the demonetization of the Indian currency in 2016 and the economic slowdown after that.
- Urban poverty rose by 2 percentage points in 2016 (coinciding with the demonetization event) and rural poverty rose by 10 basis points in 2019 (coinciding with a slowdown in the economy).
Survey used to measure Poverty by World Bank
- The paper used the Consumer Pyramids Household Survey (CPHS) – an annual survey conducted by the Centre for Monitoring the Indian Economy (CMIE). It provides estimates of how poverty and inequality in India have evolved since 2011.
- Consumer Pyramids Household Survey, produced by the Centre for Monitoring Indian Economy (CMIE), is the world's largest household panel survey, a continuous survey of more than 174,000 households in India.
- CPHS revisits its entire sample in three four-month waves each year, permitting longitudinal analysis starting in January 2014. Overall, CPHS aims to get a sense of the economic well-being of households in India and changes in their well-being over time.
- The CPHS is more recent, has wide coverage, and collects comprehensive data from Indian household living conditions.
CPHS Vs NSS: The better measure
- Consumer Pyramids Household Survey (CPHS) adopts a measure of consumption that is different from the one used in the National Service Scheme (NSS).
- NSS uses a sample design that has been flagged for undercounting the very poor and the very rich. Both of these differences have important impacts on poverty estimates for India.
- But CPHS approach represents nationally representative surveys such as the Periodic Labour Force Survey (PLFS) and the National Family Health Survey (NFHS). CPHS consumption shows the evolution of poverty in India from 2011 to 2019.
- The CPHS is already being used by scholars to measure poverty in India. For instance, the National Bureau of Economic Research (NBER) – a USA based research organization –uses CPHS survey to estimate changes in poverty and inequality during recent COVID years.
Recent IMF Report
- International Monetary Fund (IMF) recently mentioned that India has almost eradicated extreme poverty.
- India has brought down its consumption inequality to its lowest level in the last four decades. These consumption inequalities were dealt with state-provided food handouts.
- The IMF report highlighted that less than 1% of the Indian population is living under extreme poverty.
Role of India’s Food Subsidy Program
- Food ration schemes were “instrumental” in ensuring that extreme poverty did not rise during the pandemic and remind steady, the IMF study found.
- The social safety net provided by the expansion of India’s food subsidy program absorbed a major part of the pandemic shock. Food handouts curbed poverty by acting like “cash transfers”.
- Real (inflation-adjusted) inequality, as measured by the Gini coefficient, stands at 0.294. This is now very close to its lowest level 0.284 observed in 1993-94. The Gini coefficient ranges from 0 to 1, with 0 representing perfect equality and 1 representing perfect inequality.
Must Read: https://www.iasgyan.in/daily-current-affairs/poverty-in-india-4
https://www.business-standard.com/article/economy-policy/extreme-poverty-in-india-fell-sharply-in-2011-19-world-bank-paper-122041800012_1.html#:~:text=Elections-,Extreme%20poverty%20in%20India%20fell,2011%2D19%3A%20World%20Bank%20paper