Description
Disclaimer: Copyright infringement not intended.
Context
The recently released Household Consumption Expenditure Survey (HCES) for the period of August 2022 to July 2023 provides critical insights into consumption patterns, economic dynamics, and social welfare implications in India.
Details
Survey Overview
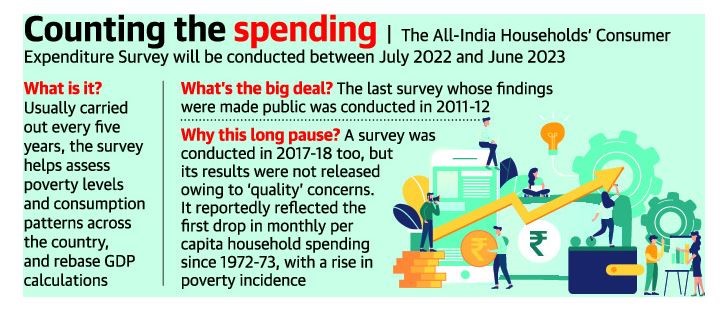
- Conducted every five years by the National Statistical Office (NSO), the HCES collects data on consumption spending patterns of households across urban and rural areas.
- Sample size: 2.6 lakh households (1.5 lakh rural, 1.1 lakh urban).
Background
- Previous survey: 2011-12.
- Delay: The 2017-18 survey was scrapped due to data quality issues.
- Pandemic-related delays: The survey couldn't be conducted in 2020-21 and 2021-22.
- Conducted from July 2022 to 2023.
Significance
- Review of Economic Indicators: The data from the survey will play a crucial role in reviewing critical economic indicators such as Gross Domestic Product (GDP), poverty levels, and Consumer Price Inflation (CPI). These indicators are essential for understanding the overall health and performance of the economy.
- Consumer Expenditure Survey Importance: The Consumer Expenditure Survey (CES) conducted by the National Statistical Office (NSO) provides valuable insights into the consumption spending patterns of households across urban and rural areas. It helps in estimating household Monthly Per Capita Consumer Expenditure (MPCE) and analyzing the distribution of households across different MPCE classes.
- Understanding Demand Dynamics: The CES data is vital for gauging the demand dynamics of the economy. It helps policymakers and economists understand the shifting priorities in terms of goods and services consumption, which is crucial for formulating appropriate economic policies.
- Assessment of Living Standards: The survey aids in assessing living standards and growth trends across various strata of society. By analyzing consumption patterns, policymakers can identify disparities and make informed decisions to address them.
- Analytical and Forecasting Tool: The CES serves as an invaluable analytical and forecasting tool. It helps policymakers identify structural anomalies that may affect demand and provides insights for producers of goods and services to align their offerings with consumer preferences.
- Rebasing GDP and Other Indicators: The data collected from the CES is used by the government in rebasing GDP and other macroeconomic indicators. Accurate and up-to-date information on consumption expenditure is essential for ensuring the accuracy of these economic measures.

Key Findings
State-specific:
- To identify the states or union territories (UTs) with a lower standard of living compared to the national average, we can look at the difference between urban and rural person's consumption spending.
- A higher difference indicates a larger urban-rural gap in consumption spending, which may suggest lower living standards in rural areas compared to urban areas within that state or UT.
- Additionally, the percentage of rural MPCE represents how much the urban consumption spending exceeds the rural spending as a percentage of rural spending.
- States/UTs with a lower standard of living compared to the national average (where the urban-rural difference is relatively higher):
- Assam: Urban consumption spending exceeds rural spending by 78.78% of rural MPCE.
- Chhattisgarh: Urban consumption spending exceeds rural spending by 81.79% of rural MPCE.
- Jharkhand: Urban consumption spending exceeds rural spending by 78.46% of rural MPCE.
- Meghalaya: Urban consumption spending exceeds rural spending by 83.06% of rural MPCE.
- Odisha: Urban consumption spending exceeds rural spending by 75.83% of rural MPCE.
- Telangana: Urban consumption spending exceeds rural spending by 69.88% of rural MPCE.
- Uttar Pradesh: Urban consumption spending exceeds rural spending by 57.94% of rural MPCE.
- West Bengal: Urban consumption spending exceeds rural spending by 62.61% of rural MPCE.
- States/UTs with a higher standard of living compared to the national average (where the urban-rural difference is relatively lower):
- Dadra & Nagar Haveli: Urban consumption spending exceeds rural spending by 50.52% of rural MPCE.
- Lakshadweep: Urban consumption spending is lower than rural spending by -7.12% of rural MPCE. (This negative value indicates that rural consumption spending is higher than urban spending.)
- Puducherry: Urban consumption spending exceeds rural spending by 16.93% of rural MPCE.
What does the difference between imputed and non-imputed average MPCE data show?
The difference between imputed and non-imputed average Monthly Per Capita Consumer Expenditure (MPCE) data in the latest Household Consumption Expenditure (HCE) Survey 2022-23 provides insights into the impact of including the value of free items received by households through social welfare programs. Here are the key findings:
- Higher MPCE with Imputed Value:
- When the imputed value of free food and non-food items is added to the MPCE data, both rural and urban households show a higher MPCE compared to data that does not include the free items.
- Absolute Benefits Across Fractile Classes:
- The analysis reveals that different fractile classes of the population benefit to varying degrees from the inclusion of the imputed value of free items.
- In rural households, the highest absolute benefit in terms of extra spend, including free items, was garnered by the population in the 70-80% fractile, followed by the top 5% of the population. The bottom 0-5% of the population received the least benefit in absolute terms.
- In urban households, the three lowest fractile classes (0-5%, 5-10%, and 10-20%) experienced the highest absolute benefits.
- Percentage Increase in Consumption Expenditure:
- The percentage increase in consumption expenditure varies across different fractile classes.
- In rural households, the bottom 5% of the population saw a 4.95% increase in consumption expenditure including free items, compared to the bottom 5% of the group that did not receive free items.
- Similarly, in urban households, the three lowest fractile classes experienced significant percentage increases ranging from 2.66% to 4.29%.
- Differential Impact on Consumption Patterns:
- The inclusion of imputed values of free items affects consumption patterns differently across rural and urban households and among different fractile classes. This highlights the importance of considering such factors in assessing household consumption dynamics and welfare.
Inflation Basket
- The data from the latest Household Consumption Expenditure (HCE) Survey 2022-23 highlights significant discrepancies between the current Consumer Price Index (CPI) basket and the actual consumption expenditure patterns of households, both in rural and urban areas.
- These disparities suggest a need to review and update the inflation basket to better reflect the changing consumption trends of Indian households.
- Here are some key insights from the average Monthly Per Capita Consumer Expenditure (MPCE) data:
- Cereals and Products:
- The CPI (Rural) basket assigns a weightage of 12.35% to cereals and products, whereas the latest HCE Survey indicates that rural households now spend just 4.91% on cereals and cereal substitutes.
- This suggests a significant mismatch between the weightage assigned in the CPI basket and the actual expenditure pattern.
- Food Expenditure:
- The share of expenditure on food in rural households according to the HCE Survey is 46.38%, whereas the CPI (Rural) basket assigns a higher weightage of 54.18% to food.
- Similarly, urban households spend 39.17% of their expenditure on food, but the CPI (Urban) basket assigns a lower weightage of 36.29% to food.
- Other Expenditure Categories:
- The HCE Survey reveals discrepancies in other expenditure categories as well. For instance, the share of spending on pan, tobacco, and intoxicants, as well as entertainment, differs from the weightage assigned in the CPI baskets for both rural and urban households.
- Additionally, there has been an increase in the share of spending on rent for both rural and urban households, indicating changes in consumption patterns that are not adequately reflected in the current CPI baskets.
Consumption Pattern
- Over the past two decades, there have been notable changes in the consumption patterns of food items among Indian households:
- Cereals:
- In 1999-2000, expenditure on cereals accounted for almost 22% of the total consumption expenditure in rural households and 12% in urban households.
- By 2022-23, this expenditure has significantly decreased, with rural households spending only 4.91% and urban households spending 3.64% on cereals.
- High-value/Nutritional Items (e.g., eggs, fish, meat, fruits, and vegetables):
- In 1999-2000, rural households spent 11.21% of their total consumption spending on these items, while urban households spent 10.68%.
- By 2022-23, there has been a noticeable increase in expenditure on these items, especially in rural households. Rural households now allocate 14% of their total consumption spending to high-value/nutritional items, compared to 11.17% in urban households.
- These changes suggest a shift towards a more diverse and nutritious diet, with households allocating a higher proportion of their expenditure to items such as eggs, fish, meat, fruits, and vegetables.
- This indicates an improvement in dietary quality and nutrition awareness among Indian households, particularly in rural areas where the increase in expenditure on these items has been more pronounced.
Spending Pattern
- Over the past two decades, there has been a notable decline in the share of spending on food in both urban and rural households in India:
- Rural India:
- In 1999-2000, the share of expenditure on food was as high as 59.4%.
- Throughout the first decade of the new millennium, it remained around 50%.
- By 2022-23, the share of expenditure on food in rural India had decreased to 46.38%.
- Urban India:
- In 1999-2000, the share of expenditure on food was 48.06%.
- Over the years, it gradually declined.
- In 2022-23, the share of expenditure on food in urban India had fallen to 39.17%.
- This decline indicates a significant shift in consumption patterns, where households are allocating a smaller proportion of their total expenditure towards food.
- As a result, more funds become available for other categories such as consumer durables, clothing, transportation, and entertainment.
- This shift reflects an improvement in living standards and aspirations, as households have more disposable income to spend on a variety of goods and services beyond basic necessities like food.

Conclusion
HCES 2022-23 sheds light on consumption dynamics, inequality, and economic trends, guiding policymakers in fostering sustainable and inclusive growth strategies. Policymakers must address income inequality and promote inclusive growth to ensure equitable consumption patterns. Adjustments to CPI weightings based on survey data are crucial for accurate inflation measurement and policy formulation.
|
PRACTICE QUESTION
Q. The Household Consumption Expenditure Survey (HCES) 2022-23 conducted by the Ministry of Statistics and Programme Implementation is a critical tool for understanding consumption patterns and economic dynamics in India. Critically Analyse. (250 words)
|