Chandigarh is the top performer in school education for 2023-24, according to the Education Ministry's Performance Grading Index 2.0, with Meghalaya ranking lowest. The report shows 24 States/UTs improved their scores while 12 declined. Bihar and Telangana made the most progress in improving access to education for students.

Copyright infringement not intended
Picture Courtesy: THE HINDU
The 2023-24 Performance Grading Index 2.0 report on school education in states and Union Territories.
The Ministry of Education has released the Performance Grading Index (PGI) 2.0 report for the academic year 2023-24.
This index assesses the performance of school education systems across all States and Union Territories.
The PGI was first introduced in 2017 and was updated to PGI 2.0 in 2021 to align with the National Education Policy (NEP) 2020 and Sustainable Development Goals.
The primary aim of the PGI is to promote evidence-based policymaking and encourage states to enhance learning outcomes by identifying areas for improvement.
Assessment Framework
The PGI 2.0 framework evaluates states and UTs based on a total of 1,000 points across 73 indicators. These indicators are grouped into two main categories: Outcomes, and Governance & Management. These are further divided into six key domains:
Data for these indicators is sourced from multiple platforms, including the Unified District Information System for Education Plus (UDISE+), the National Achievement Survey (NAS) of 2021, and the PM-POSHAN portal.
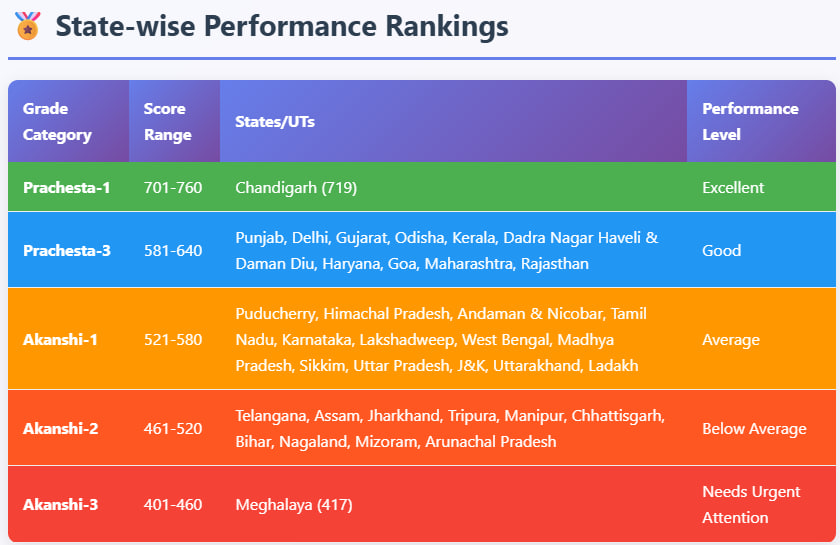
States and UTs are assigned to one of 10 grades based on their scores. The highest grade is 'Daksh' (941-1000), and the lowest is 'Akanshi-3' (401-460).
Overall Performance Trends => 24 states and UTs have shown improvement in their scores compared to the previous year. However, 12 states and UTs have seen a decline in their performance. No state or UT has managed to secure a score above 760, placing none in the top grade bands.
Top and Bottom Performers
Best Performer => Chandigarh stands as the sole entity in the 'Prachesta-1' grade, achieving a score of 719.
Lowest Performer => Meghalaya is at the bottom of the index with a score of 417, falling into the 'Akanshi-3' category.
Prachesta-3 (Score 581-640) => This category includes 10 states and UTs such as Punjab, Delhi, Gujarat, Kerala, and Maharashtra.
Akanshi-2 (Score 461-520) => Ten states, including Telangana, Assam, Bihar, and Jharkhand, are in this category, indicating a need for improvement.
 State-Specific Improvements
Access to Education => Bihar and Telangana have demonstrated the most significant improvements in this domain, which covers student enrollment, retention, and mainstreaming of out-of-school children.
Infrastructure => Delhi, Jammu & Kashmir, and Telangana have made the most substantial progress in improving school infrastructure. This includes facilities like toilets, drinking water, electricity, and ICT labs.
|
The PGI serves as a critical tool for monitoring the health of the school education system. It promotes a competitive spirit among states and provides a clear roadmap for targeted interventions. |
Must Read Articles:
Global Education Monitoring (GEM) Report
Source:
|
PRACTICE QUESTION Q. Consider the following statements regarding the Performance Grading Index (PGI) 2.0: 1. It is a mandatory assessment where States/UTs are ranked to promote competition. 2. It aligns with the objectives of the National Education Policy (NEP) 2020 and Sustainable Development Goals (SDGs). 3. The framework uses 73 indicators distributed across six distinct domains. 4. Data for the index is sourced exclusively from the Unified District Information System for Education (UDISE) Plus. How many of the above statements are correct? A) Only one B) Only two C) Only three D) All four Answer: B Explanation: Statement 1 is incorrect. The Ministry of Education states that the PGI uses a grading system, not ranking, to avoid creating a stigma of underperformance and to encourage states to improve based on their specific needs rather than just outperforming others. Statement 2 is correct. The PGI 2.0 was restructured to align its indicators with the goals of the NEP 2020 and the SDG for quality education (SDG-4) Statement 3 is correct. PGI 2.0 assesses states on a total of 1000 points across 73 indicators, which are grouped into six domains: Learning Outcomes, Access, Infrastructure & Facilities, Equity, Governance Processes, and Teacher Education & Training. Statement 4 is incorrect. While UDISE+ is a key data source, the PGI also draws data from the National Achievement Survey (NAS) and the Pradhan Mantri Poshan Shakti Nirman (PM POSHAN, formerly Mid-Day Meal scheme). |


© 2026 iasgyan. All right reserved