India’s February 2026 IIP data reveals a K-shaped recovery. While government capex boosts manufacturing, lagging consumer demand signals structural gaps. Achieving Viksit Bharat 2047 requires shifting to employment-intensive growth, MSME support, and boosting household purchasing power to bridge this divide.
Why In News?
The Ministry of Statistics and Programme Implementation (MoSPI) data for February 2026 indicates that India's industrial growth rose to 5.2%.
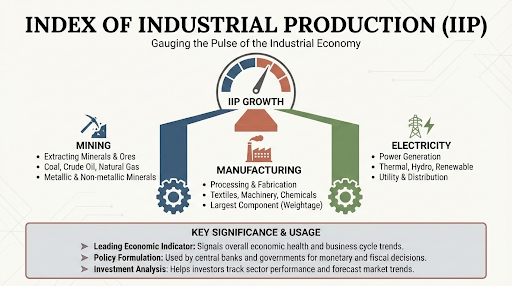
What is Index of Industrial Production (IIP)?
The Index of Industrial Production (IIP) tracks the short-term volume changes in the production of a specific basket of industrial products.
Publishing Agency: Monthly by the National Statistical Office (NSO) under the Ministry of Statistics and Programme Implementation (MoSPI).
Timeline: The 28th of every month (or the next working day if the 28th is a holiday).
Base Year: The current base year is 2011–12.
Key Components
This identifies where the production is happening:
This identifies how the products are used in the economy:
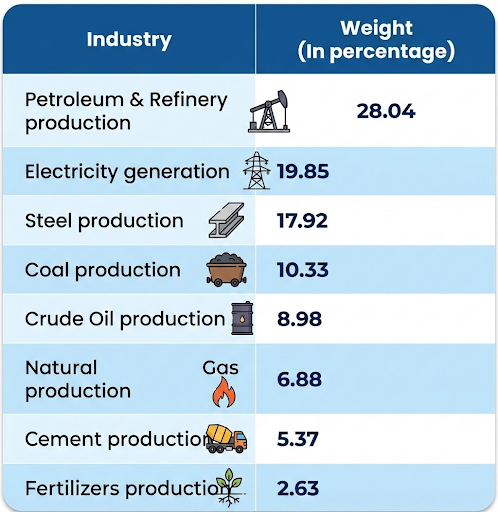
The "Eight Core Industries"
Nearly 40.27% of the IIP comprises the Index of Eight Core Industries (ICI). These are considered the structural pillars of the Indian economy.
Ranking by Weightage (High to Low):
Strategic Significance
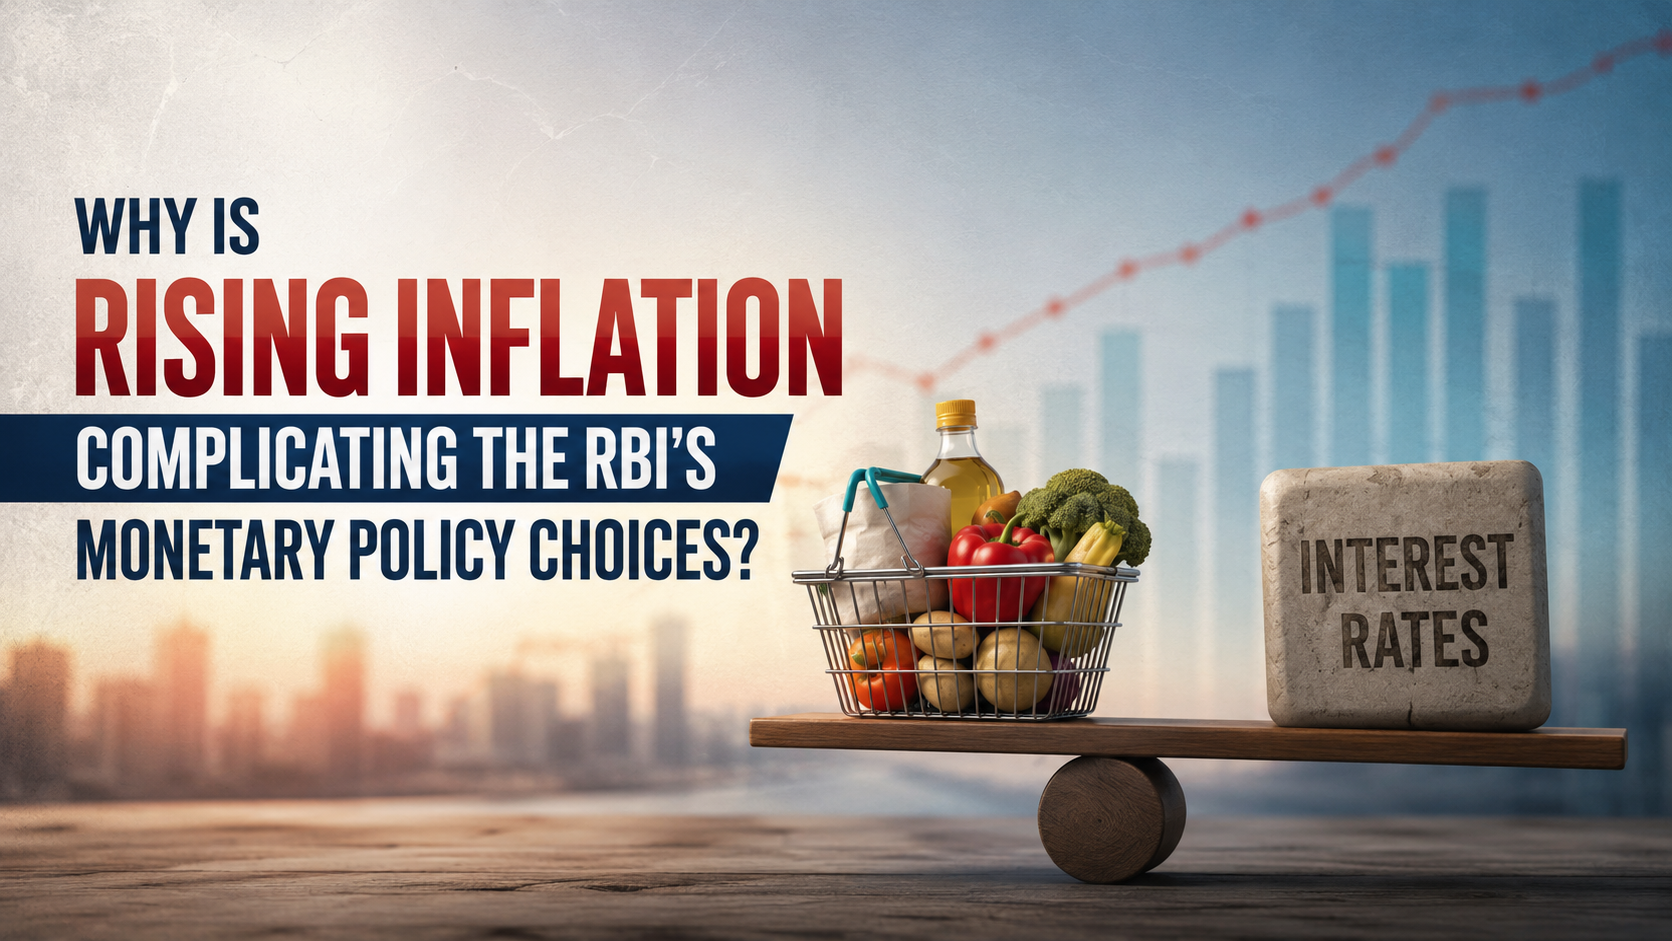
Policy Formulation: The Reserve Bank of India (RBI) closely monitors IIP to decide on repo rates during Monetary Policy Committee (MPC) meetings.
GDP Calculation: It is a critical input for the "Quarterly and Advance Estimates" of the Gross Domestic Product (GDP).
Economic Health: A high Capital Goods growth suggests robust private investment, while high Consumer Durables growth indicates strong urban demand.
What are the Key Takeaways from the February 2026 Data?
The data highlights a clear split between investment and consumption drivers within the Indian economy.
|
Sector |
Growth Rate |
Details |
|
Capital Goods |
12.5% (9-month high) |
Indicates strong investment activity, likely driven by government capital expenditure (capex) and corporate expansion. |
|
Manufacturing |
6.0% |
Shows robust supply-side activity, supported by government schemes. |
|
Consumer Durables |
-2.1% (Contraction) |
Worst performance in 27 months; signals weak demand for high-value items like vehicles and appliances among households. |
|
Consumer Non-Durables |
-0.6% (Contraction) |
Reflects distress in rural and low-income urban households, affecting sales of daily-use items (FMCG). |
|
Mining & Quarrying |
3.1% (Deceleration) |
Slowdown points to potential bottlenecks in core industrial inputs. |
|
Electricity Generation |
2.3% (Sharp Slowdown) |
Indicates slowing momentum and potential energy infrastructure challenges. |
What are the Structural Bottlenecks Hindering Broad-Based Growth?
MSME Credit Gap
Micro, Small, and Medium Enterprises (MSMEs) contribute nearly 45% of manufacturing output but face a massive credit gap estimated at ₹20-25 lakh crore. This prevents them from investing in modern technology and expansion. (Source: U.K. Sinha Committee Report on MSMEs)
Energy Transition Friction
The slowdown in mining and electricity sectors points to challenges in India's energy transition. Integrating 500 GW of non-fossil fuel energy by 2030 creates grid stability issues, leading to erratic power supply for industrial clusters.
Low R&D Spending
India's spending on Research and Development is only 0.65% of its GDP, far below the global average of 1.8%. This limits innovation and prevents Indian firms from moving up global value chains. (Source: NITI Aayog)
Unsustainable Growth Model
Growth led purely by government and corporate capex is not sustainable. Without robust consumer demand, companies will eventually halt capacity expansion, as there will be no one to buy the final products.
Incomplete Economic Recovery
The slump in consumer goods indicates that the economic recovery is not broad-based. It is primarily benefiting large corporations while household finances remain under stress.
Stagnant Household Incomes
The contraction in non-durables is a direct reflection of weak purchasing power, linked to subdued real rural wage growth, which has struggled to keep pace with inflation.
Way Forward
Boost Supply-Side Competitiveness: Implement the Economic Survey's "mission-based approach" by simplifying labor laws, reducing the compliance burden on MSMEs, and creating a frictionless environment for investment.
Revive Demand-Side Consumption: Boost demand is by creating well-paying jobs. Focus on labor-intensive sectors like textiles, food processing, and footwear.
Learn from Global Best Practices
|
|
Key Features |
Lesson for India |
|
Vietnam: Export-Led Integration |
Simplified labor laws and created efficient Special Economic Zones (SEZs) with plug-and-play infrastructure to attract "China Plus One" FDI. |
Replicate this model of administrative efficiency in planned industrial parks like the Mega Investment Textiles Parks (MITRA). |
|
Germany: 'Mittelstand' Model |
Relies on a network of highly specialized, tech-driven Small and Medium Enterprises (SMEs). The government subsidizes the adoption of Industry 4.0 (AI, IoT, automation). |
Create targeted schemes to subsidize technology adoption (AI, automation) for Indian MSMEs to boost their global competitiveness. |
Conclusion
Transforming the current uneven recovery into a broad-based economic boom depends on creating quality employment that empowers consumers to spend, thereby creating a virtuous cycle of demand and investment.
Source: THEHINDU
|
PRACTICE QUESTION Q. Consider the following statements regarding the Index of Industrial Production (IIP) in India: 1. It is compiled and published monthly by the Ministry of Statistics and Programme Implementation (MoSPI). 2. An increase in the capital goods sector always translates to an immediate equivalent increase in consumer durables. Which of the statements given above is/are correct? a) 1 only b) 2 only c) Both 1 and 2 d) Neither 1 nor 2 Answer: A Explanation: Statement 1 is correct: The Index of Industrial Production (IIP) is a composite indicator measuring short-term changes in the volume of industrial products. It is compiled and published monthly by the National Statistical Office (NSO), which operates under the Ministry of Statistics and Programme Implementation (MoSPI). Statement 2 is incorrect: In economic terms, there is no rule that an increase in the capital goods sector (which includes machinery and equipment used for production) "always" translates to an "immediate equivalent" increase in consumer durables (like cars or appliances). While capital goods can indicate future production capacity, consumer durables depend on separate factors like household purchasing power and market demand. |
The Index of Industrial Production (IIP) is a composite indicator that measures the short-term changes in the volume of production of a basket of industrial products during a given period with respect to a chosen base period. It is a vital metric for understanding the health of the manufacturing, mining, and electricity sectors in India.
The IIP data in India is compiled and released monthly by the National Statistical Office (NSO) under the Ministry of Statistics and Programme Implementation (MoSPI).
The data indicates a "K-shaped" or twin-speed recovery. While there is a robust surge in manufacturing (6%) and capital goods (12.5%) driven by government capital expenditure, consumer durables and non-durables are contracting, showing a slump in domestic household purchasing power.


© 2026 iasgyan. All right reserved