Disclaimer: Copyright infringement not intended.
Context
- The India Meteorological Department (IMD) declared the season’s first heat wave and severe heat wave March 11 and the first depression March 3.
What is a Heat Wave?
- A heat wave is a period of abnormally and uncomfortably hot and usually humid weather.
- According to the World Meteorological, a heat wave is when the daily maximum temperature for more than five consecutive days exceeds the average maximum temperature by 9 degrees Fahrenheit.
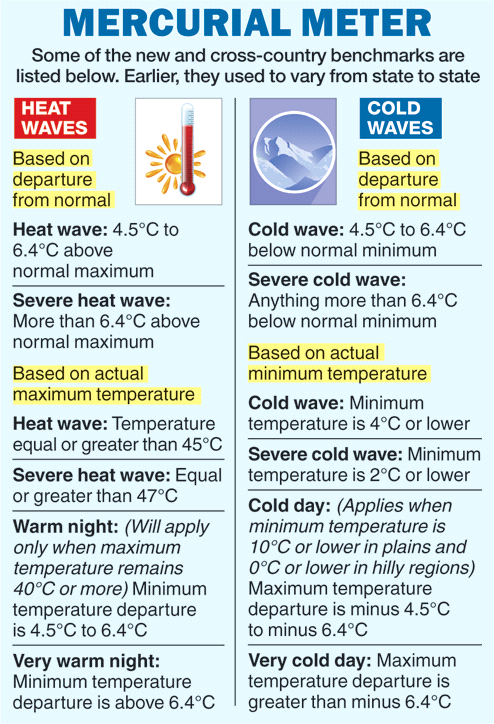
Heat wave Criteria:
In India, Heat wave is considered if maximum temperature of a station reaches atleast 40 degree C or more for Plains and at least 30 degree C or more for Hilly regions.
a) Based on Departure from Normal
Heat Wave:Departure from normal is 4.5 degree C to 6.4 degree C
Severe Heat Wave: Departure from normal is >6.4 degree C
b) Based on Actual Maximum Temperature
Heat Wave: When actual maximum temperature ≥ 45 degree C
Severe Heat Wave: When actual maximum temperature ≥47 degree C
c) Warm Night
It should be considered only when maximum temperature remains 40 degree C or more. It
may be defined based on departures or actual minimum temperatures as follows:
Warm night: minimum temperature departure is 4.5 degree C to 6.4 degree C
Very warm night: minimum temperature departure is >6.4 degree C
d) Criteria for describing Heat Wave for coastal stations
When maximum temperature departure is 4.5 degree C or more from normal, Heat Wave may be declared provided actual maximum temperature is 37 degree C or more.
How do heat waves form?
- A heat wave is formed when static high pressure generated in the upper atmosphere over a region for several days up to several weeks.
- This static high pressure generates a hot mass of air, which is stagnant for many days and week, which resulted the trapping of more heat that also reduce the convention currents.
- The high pressure acts as a barrier and forces the mass of air to sink to the surface of the land that prevents heat to rise.
- This hot mass of air accumulates only heat and humidity without any trace of precipitation that causes abnormally high temperatures. It is very often during the summer season, from May to November in the northern hemisphere.
- The seal keeps out convection currents that form clouds and eventually rain clouds, both of which would help the area affected cool off.
- Instead the result is a heat wave that has both high heat and high humidity near the ground.
- These heat waves can last from days to weeks.
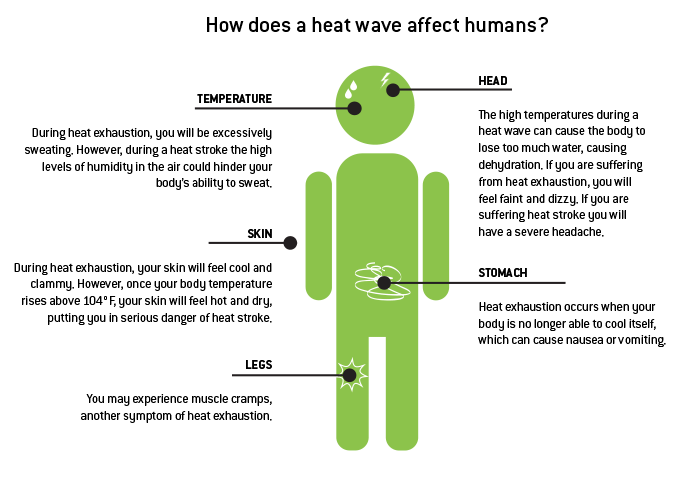
Implications of Heat Waves
Social impacts
- Extreme heat can lead to heat-related illness and death, particularly in elderly populations, the poor, outdoor workers, and in urban areas.
- Heat waves exacerbate the urban heat island effects, amplifying temperatures in built environments, and resulting in poorer air quality due to the creation of ozone that negatively impacts health.
- Heat-related mortality is expected to be higher in cities, particularly those characterized by high population density, inequalities, limited access to health care, high pollution levels and fewer green spaces.
Economic impacts
- Multiple areas of the economic sector experience reduced worker productivity during heatwaves, especially agriculture and construction.
- Globally, 2% of total working hours is projected to be lost every year, either because it is too hot to work or because workers have to work at a slower pace.
- Lost productivity from heat stress at work, particularly in developing countries, is expected to be valued at $4.2 trillion dollars per year by 2030, driving more inequality.
- The agricultural sector, where 940 million people earn their livelihood, is set to be harder hit by hotter temperatures, pushing workers, crops and livestock past their physiological heat and drought tolerances.
- This will result in lost labour, in smaller harvests for farmers, higher prices for consumers, and negative impacts on livelihoods.
- A World Bank report suggests that by 2050, about 600 million Indians will live in places that could experience loss of living standards, which could cost 2.8% of the GDP, stalling efforts to pull large parts of the population out of poverty.
- Increasing energy demand for cooling also comes as an extensive economic cost to residents, businesses, and governments.
- With these extreme heat events, the need for access to cooling should be viewed as a basic necessity – not just for health and productivity reasons but, in some cases, even for survival.
Ecological impacts
- Heat waves, without concomitant increases in precipitation, can lead to water shortages and increased stress for plants, particularly in arid regions.
- This has the effect of reducing plant growth, the basis of energy production and the food chain, with an overall drying-out of the landscape.
- For example, the 2003 European heatwave resulted in a 10% loss in glacier mass in Europe, which was five-times more than the average annual loss.
- Similar impacts were reported for the French Alps in 2019.
- Over time, such deep permafrost warming and thawing could cause landslides and rock falls, continuing the negative ecological impacts.
How long can a heat wave spell last?
- A heat wave spell generally lasts for a minimum of four days.
- On some occasions, it can extend up to seven or ten days.
- The longest recorded heat wave spell, in recent years, was between 18 – 31 May 2015.
- This spell had severely affected parts of West Bengal along with Odisha, Andhra Pradesh, and Telangana.
- A similar spell in 2014 was reported during June 2 – June 11.
Does all of India experience heat wave conditions?
- Heat waves are common over the Core Heatwave Zone (CHZ) — Rajasthan, Punjab, Haryana, Chandigarh, Delhi, West Madhya Pradesh, Uttar Pradesh, Chhattisgarh, Orissa, Vidarbha in Maharashtra, parts of Gangetic West Bengal, Coastal Andhra Pradesh and Telangana, as categorised by India Meteorological Department.
- Several recent studies indicate that CHZ experience more than six heatwave days per year during these four months.
- Many places in the northwest and cities along southeastern coast report eight heatwave days per season.
- However, the regions in the extreme north, northeast and southwestern India are lesser prone to heatwaves.
Early arrival of 2022 Heat Waves
- Heat waves on land and depressions in the sea this year have started early in and around India, because of unexpected climatic anomaly.
Persistence of La Nina
- The reason behind early heat waves, early depressions and the weird dust storms is the continued persistence of a north-south low pressure pattern that forms over India during winters when a La Niña phenomenon is occurring in the equatorial Pacific Ocean.
- The sea surface temperatures over the east and central Pacific Ocean become cooler-than-average during La Niña. This affects the trade winds flowing over the ocean surface through change in wind stress.
- The trade winds carry this weather disturbance elsewhere and affect large parts of the world. In India, the phenomenon is mostly associated with wet and cold winters. Therefore, the current effect of La Niña is completely unexpected.
- The La Niña produced a north-south pressure pattern over India as expected during the winter but it seems to be persisting in some form.
- Dust storm, the early deep depressions and the heat waves are all part of this weird persistence.
La Nina persistence and the other parts of the world
- The weird persistence of the La Niña is also affecting other regions of the world.
- The temperatures over western Russia, down to Kazakhstan and over Pakistan, Afghanistan, all the way into Spain and Portugal were more than 10 degree Celsius warmer during February.
- The last time we had a La Niña persisting for three years was during 1998-2000 and 2000 also had a cyclone in March. So the La Niña is interacting with the warm Arctic region sending atmospheric waves down.
La Nina and Warm Arctic interaction
- If the interaction between the La Nina and the warm Arctic currents is happening then it is an impact of global warming induced by human greenhouse gas emissions.
- The dust storms drastically brought down Mumbai’s air quality for days after the events happened in January and February. There were recent Deep depressions in the Bay of Bengal about to form Cyclone.
- There has been occurrence of heat waves in the mountain states of Himachal Pradesh, Uttarakhand and union territory of Jammu and Kashmir.
- This would hasten the melting of snow and glaciers in these regions which, in turn, would affect the availability of water for the people.
- Apart from causing massive impacts to human health, even deaths, heat waves can impact agricultural crop yields as they can often lead to drought.
|
MoES Report
The “Assessment of Climate Change over the Indian Region” Report prepared by the Union Ministry of Earth Sciences has cautioned that by the end of 2100, the “frequency of summer [April–June] heat waves over India is projected to be three to four times higher” and the “average duration of heatwave events is also projected to approximately double.”
The impact of heatwave stress is expected across India but particularly over the densely populated Indo-Gangetic river basin.
IPCC Report
According to The Intergovernmental Panel on Climate Change (IPCC Special Report on Oceans and Cryosphere in a Changing Climate) India will witness marine heat waves, extreme El Niños, and extremely severe cyclones in response to increasing carbon emissions due to continued burning of fossil fuels.
|
Heatwave levels
- Heatwave warning levels and the vigilance required are assigned colours — Yellow (level 2), Orange (level 3) and Red (level 4).
- These heatwave warning levels are forecast based on weather forecasts, complemented to a frequency analysis of 30 years of data on mortality rate with weather indicators.
- The information provided by health services are also a part of the forecasts.
ENSO Cycle
- El Niño–Southern Oscillation (ENSO) is an irregularly periodic variation in winds and sea surface temperatures over the tropical eastern Pacific Ocean.
- Every three to seven years, the surface waters across tropical Pacific Ocean warm or cool by 1°C to 3°C, compared to normal.
- The warming phase of the sea temperature is known as El Niño and the cooling phase as La Niña.
- Thus, El Niño and La Niña are opposite phases of what is known as the El Niño-Southern Oscillation (ENSO) cycle.
- These deviations from normal surface temperatures can have large-scale impacts not only on ocean processes, but also on global weather and climate.
Note: El Niño and La Niña are the extreme phases of the ENSO cycle; between these two phases is a third phase called ENSO-neutral.
Concepts we need to know before we delve deeper into the ENSO mechanism
A thermocline is the transition layer between the warmer water at the surface and the cooler deep water below.
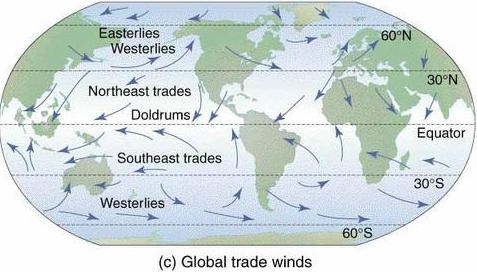
The trade winds or easterlies are the permanent east-to-west prevailing winds that flow in the Earth's equatorial region (between 30°N and 30°S latitudes).
Convection is the process generally associated with warm rising air and the formation of cloud.
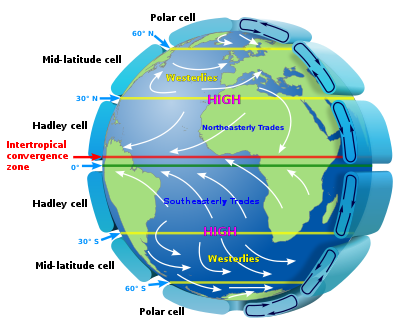
ENSO Mechanism
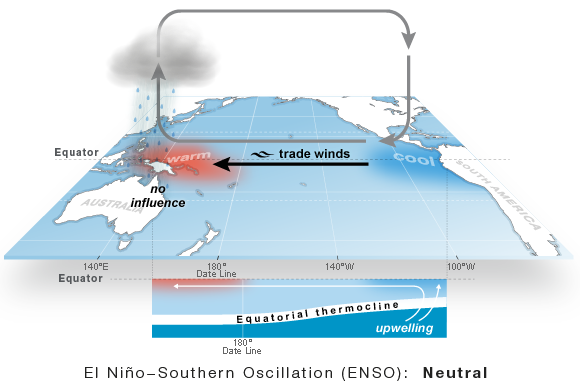
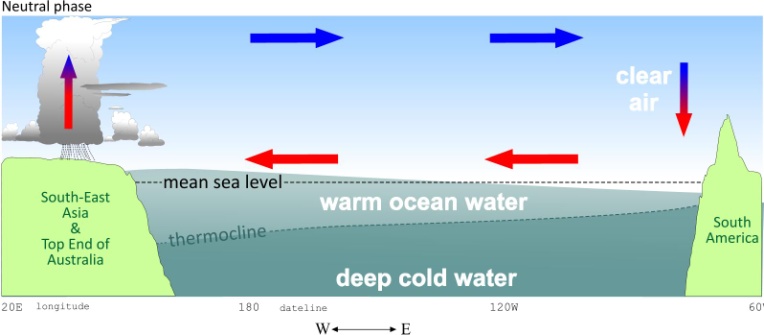
The 'Neutral phase'
- Under ‘normal’ conditions, we have a situation referred to as a Neutral phase.
- At first, Easterly Trade Winds (blowing from east to west) push the warm surface water away from South America towards tropical South-East Asia.
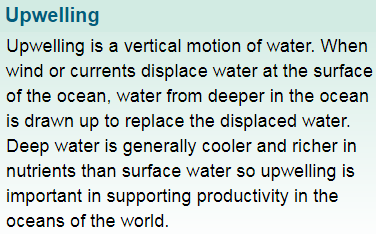
- Conversely, off the west coast of South America the depth of the warm equatorial top layer of the ocean has reduced, and the thermocline is nearer the ocean surface. This means that cold, nutrient-rich water upwells into the upper parts of the ocean here.
- Around tropical South-East Asia, warm surface water evaporates.
- Thiscauses increased rainfall around Indonesia and neighbouring lands such as the Top end of Australia.
- In contrast, over the eastern tropical Pacific and off the coast of Peru, dry air accompanied with cloud dissipation sinks, resulting in much drier weather there.
Note: The pattern of air rising in the west and falling in the east with westward moving air at the surface is referred to as the Walker Circulation.
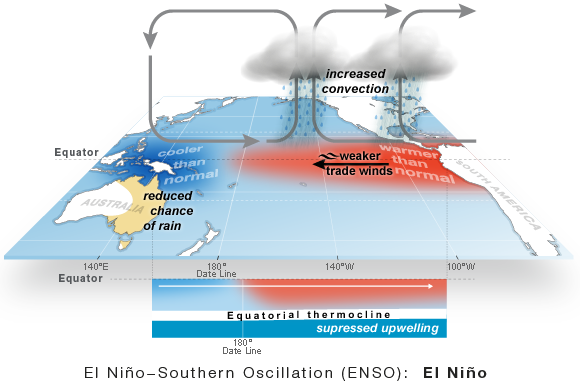
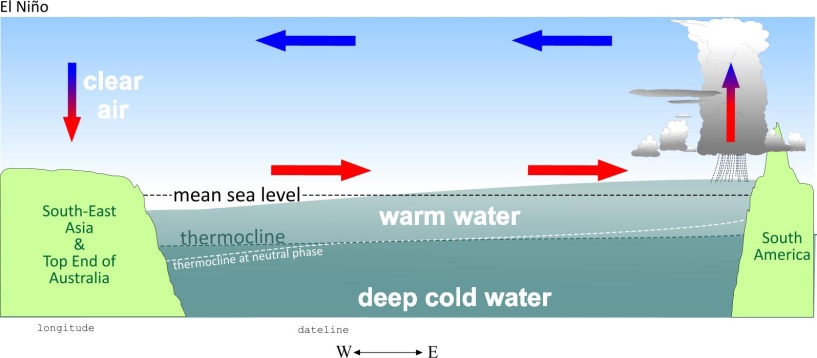
El Niño Phase
- The Trade Winds loses most of their strength in an El Niño phase, and may even reverse into a westerly wind (west to east) direction.
- As a result, warm surface water from tropical South-East Asiaflows towards the coast of South America.
- Off the coast of South America, the thermocline sinks. The cold deep water no longer upwells into the surface layer of the ocean.
- The source of nutrients is cut off, which has a subsequent effect on fishing stocks off South America.
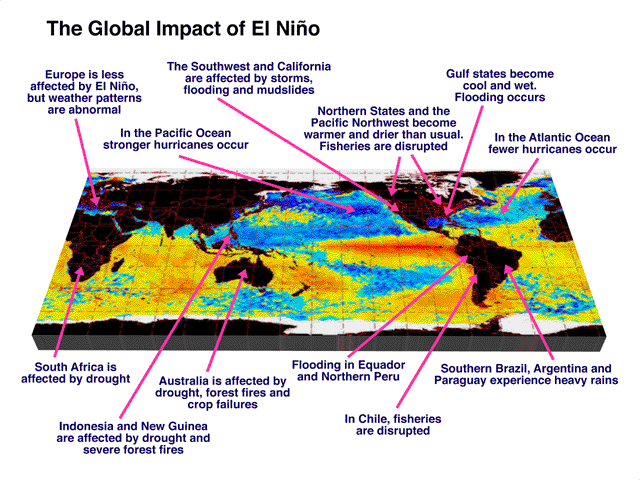
- Nearby, over the eastern tropical Pacific, warm surface water evaporates. This results in more rainfall than usual there.
- Conversely, on the other side of the Pacific, Indonesia and neighbouring countries are drier than usual during an El Niño.
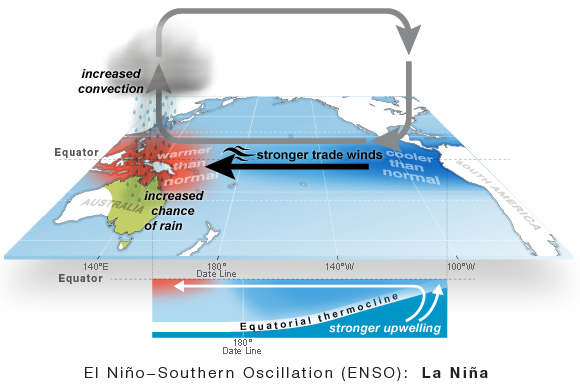
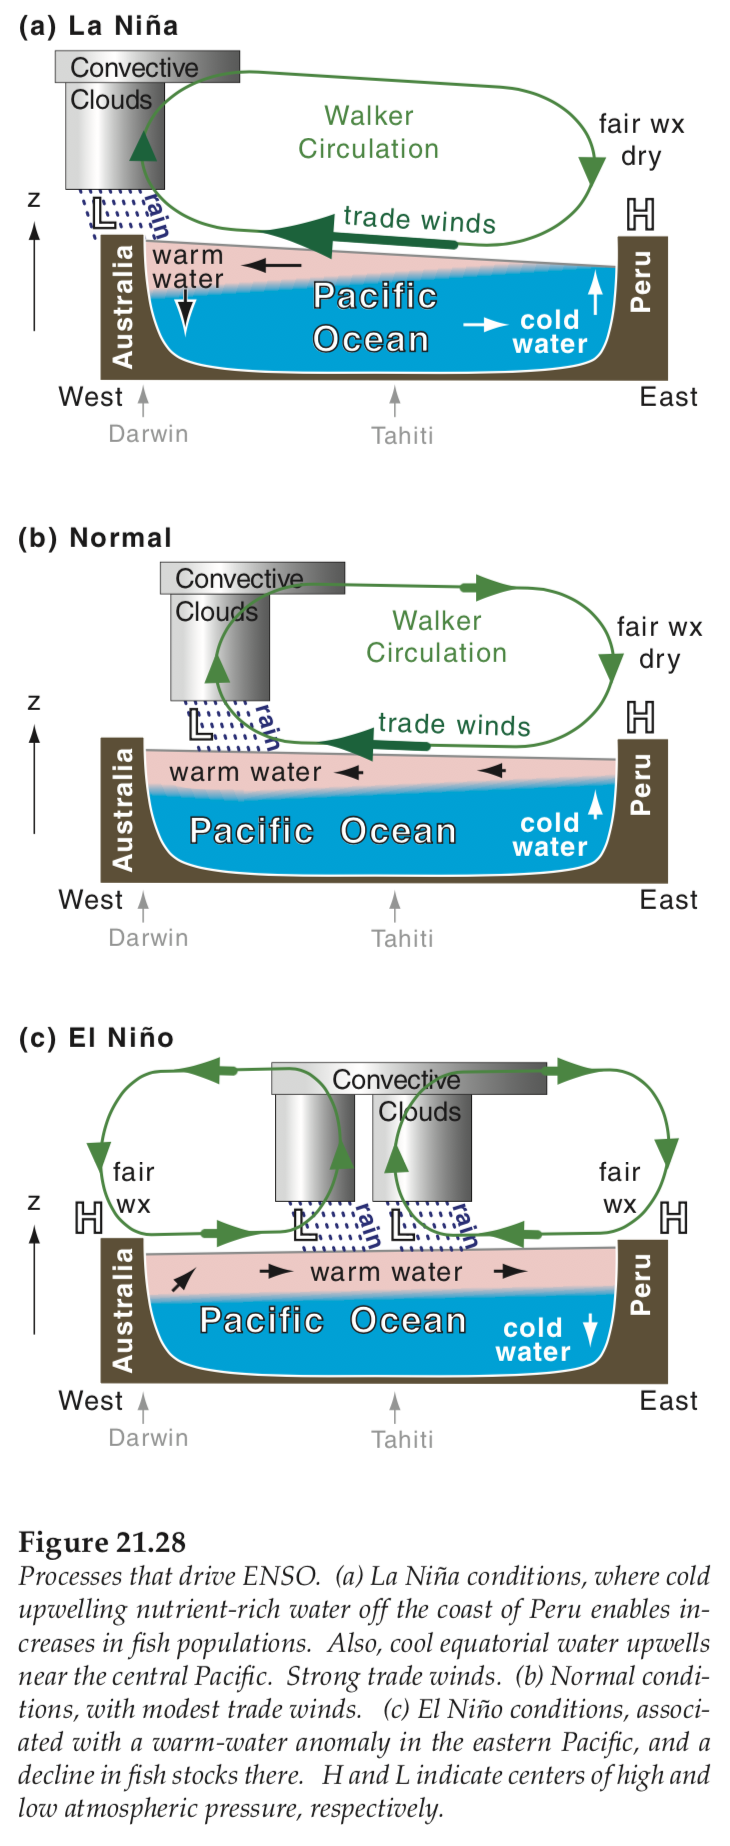
La Niña Phase
- In this pattern, trade winds blow warm water at the ocean’s surface from South America to Indonesia.
- As the warm water moves west, cold water from the deep rises to the surface near the coast of South America.
- Since, La Niña blows all of this warm water to the western Pacific places like Indonesia and Australia get much more convectionalrain than usual.
- However, the cold water in the eastern Pacific causes less rain clouds to form there. So, places like the southwestern United States are much drier than usual.
- La Nina can also lead to more lightning activity within the Gulf of Mexico and along the Gulf Coast.
- And more tropical cyclones—which include hurricanes—forming in the deep tropics (near the islands in the Caribbean, for example).
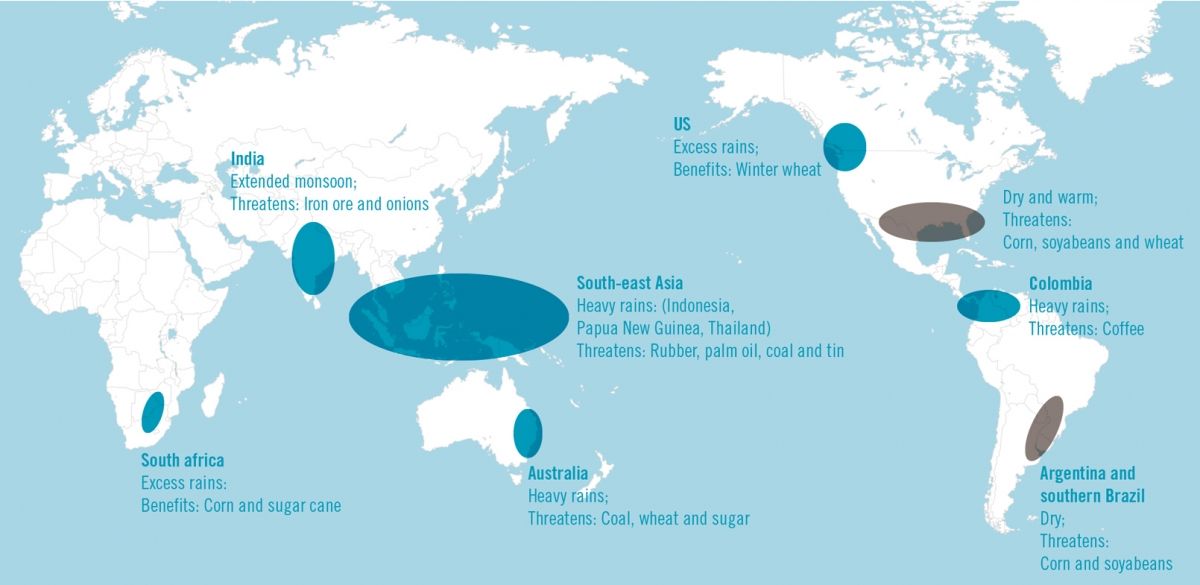
- In a nutshell, La Nina causes drought in the South American countries of Peru and Ecuador, heavy floods in Australia, high temperatures in Western Pacific, Indian Ocean, off the Somalian coast and a comparatively better monsoon rains in India.
Impact of La Niña
|
ENSO and India
El Nino and La Nina impact India greatly.
El Nino during winter causes warm conditions over the Indian subcontinent and during summer, it leads to dry conditions and deficient monsoon. Whereas, La Nina results in better than normal monsoons in India.
India experienced deficient rainfall during El Nino years 2002 and 2009 whereas monsoon was normal during El Nino years 1994 and 1997. It means that in about 50 per cent of the year with El Nino during summer, India experienced droughts during monsoon.
Crops like Paddy, Maize, Groundnut, Guar, Castor, Tur, Moong and Bajra suffer due to El Nino.
|
https://www.downtoearth.org.in/news/climate-change/warm-arctic-waves-la-ni-a-to-blame-for-early-heat-waves-depressions-experts-82132