Copyright infringement not intended
Picture Courtesy: https://timesofindia.indiatimes.com/home/environment/rare-triple-dip-la-nina-behind-unusual-air-quality-trend-in-india-in-2022-23-study/articleshow/107793077.cms
Context: The study conducted by researchers at the National Institute of Advanced Studies and the Indian Institute of Tropical Meteorology sheds light on the link between La Nina events and air quality in Indian cities, particularly during the winter of 2022.
Details
Link between Pollution and Winter Months in India
Deviation in Winter 2022

Impact of La Nina on Air Quality
Extended La Nina and Climate Change
Accumulative Effect and Uncertainty with El Nino
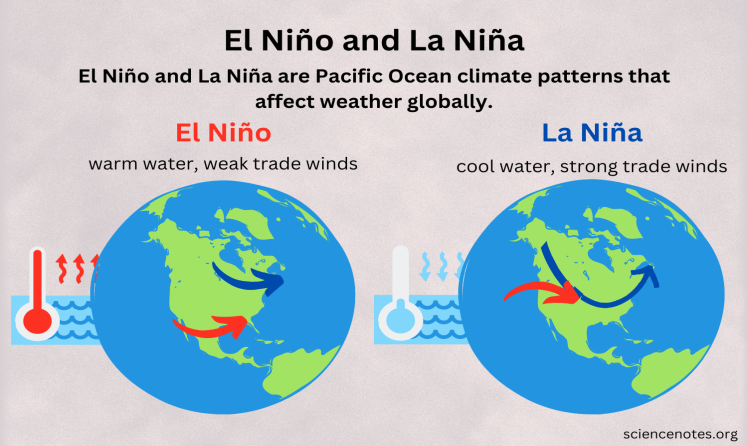
El Niño v/s La Niña
|
Aspect |
El Niño |
La Niña |
|
Ocean Temperature |
Warmer-than-average sea surface temperatures in the central and eastern Pacific Ocean. |
Colder-than-average sea surface temperatures in the central and eastern Pacific Ocean. |
|
Atmospheric Effects |
Weaker trade winds, leading to changes in atmospheric circulation patterns. |
Stronger trade winds, influencing atmospheric circulation patterns. |
|
Rainfall Patterns |
Enhanced rainfall in the central and eastern Pacific, leading to flooding in some regions. |
Reduced rainfall in the central and eastern Pacific, often causing drought in some areas. |
|
Upwelling |
Reduced: Less upwelling of cool water due to weaker winds. |
Increased: Increased upwelling of cool water due to stronger winds. |
|
Global Effects |
Increased rainfall: California, South America, East Africa Drought: Australia, Indonesia, Southeast Asia Warmer winters: North America, Northern Europe Stronger tropical storms: Pacific Ocean |
Drought: Southern US, Australia, East Africa Increased rainfall: Pacific Northwest, Canada, South America Cooler winters: Northern US, Canada Weaker tropical storms: Pacific Ocean |
|
Occurrences |
Typically occurs every 2 to 7 years. |
Typically occurs every 2 to 7 years, but not necessarily in alternating patterns with El Niño. |
|
PRACTICE QUESTION Q. Which of the following is associated with El Niño conditions? A) Cooler than average sea surface temperatures in the eastern Pacific Ocean B) Increased upwelling of cold water from the depths of the Pacific Ocean C) Stronger trade winds blowing from east to west across the Pacific Ocean D) Warmer than average sea surface temperatures in the eastern Pacific Ocean Answer: D Explanation: El Niño is characterized by warmer than average sea surface temperatures in the eastern Pacific Ocean. (A), (B), and (C) are all associated with La Niña conditions. |


© 2026 iasgyan. All right reserved